Dated June 2020
Sugar Land Real Estate Terminology
Buyer’s Market vs. Seller’s Market
The Sugar Land real estate market is constantly changing. The way we determine the type of real estate market we’re in (Buyer’s Market vs. Seller’s Market) is based on the amount of Inventory (homes available for sale) currently available. Six months of inventory is usually considered “equilibrium” —neither a Seller’s or Buyer’s Market. A Buyer’s Market is considered to be 7 months or more of inventory. This is where the demand for homes is somewhat less than the supply of homes and when Buyers may have more control over house prices than Sellers. A Seller’s Market is considered to be 5 months or less of inventory. This is where the demand for homes is somewhat greater than the supply of homes and when Sellers may have more control over house prices than Buyers.
Months of Inventory
Months of Inventory refers to the number of months it would take to sell all of the currently listed homes on the Sugar Land real estate market, with no new homes being added. This may also be called the “Absorption Rate” because it is the rate in which houses are “absorbed” in the current market. Generally speaking, if Inventory is greater than 6 months, then it is a “Buyers Market,” and if Inventory is less than 6 months, then it is a “Sellers Market.”
|
Months of Inventory = |
# Active on the Market (# Sold in Past 12 mths 12 mths) |
Cumulative Days On Market
How long it takes to sell homes can be a good indicator for “how’s the market”? The longer it takes to sell homes, on average, the slower the market. So if the cumulative number of Days on Market is increasing, then the market may be slowing down, and if CDOM is decreasing, then the market may be speeding up.
“Days on Market” refers to the days a specific home listing has been on the MLS. If the real estate agent Terminates the listing and then relists it with a new MLS number, then the DOM resets. However, the Cumulative Days On Market should show the total Days on Market for that particular home, regardless of the number of time it is terminated and relisted by one or more real estate agents.
Keep in mind that areas with lower-priced homes will usually sell faster than luxury-priced areas, because the more affordable the home’s price, the larger the number of potential buyers, and the quicker it can sell.
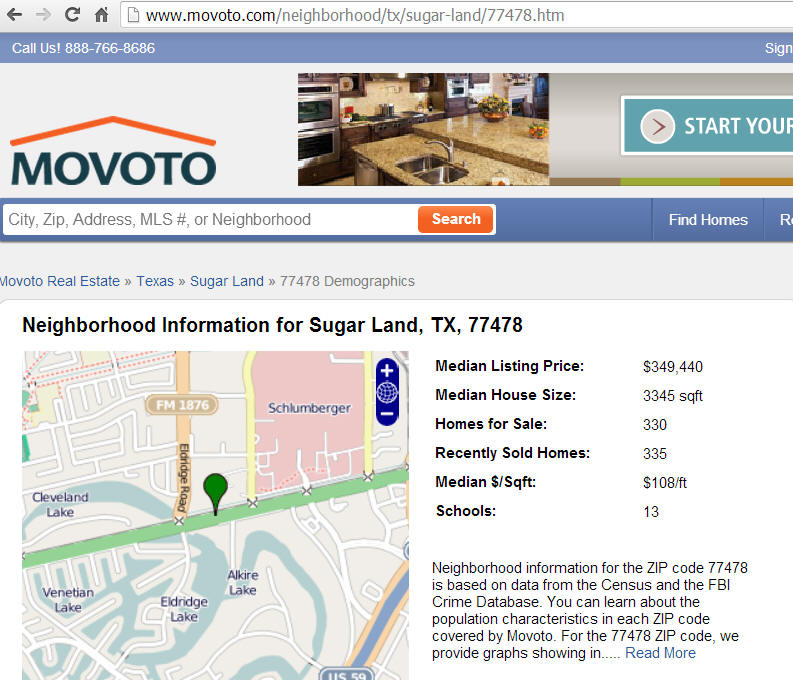
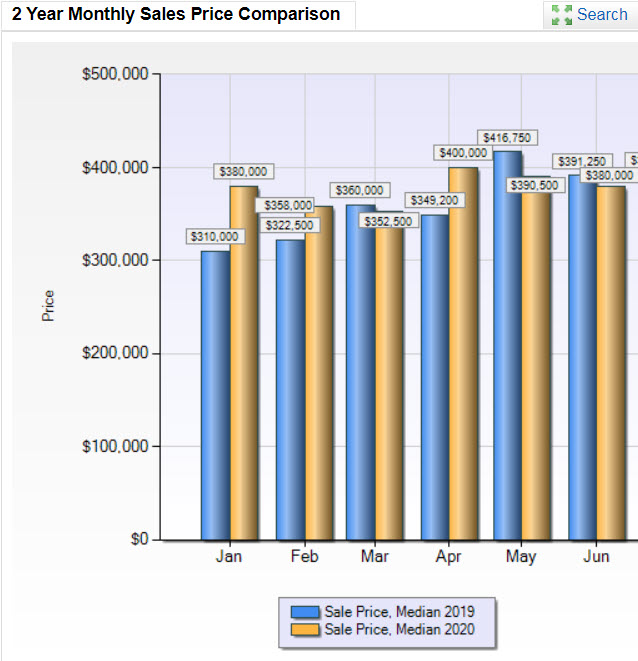
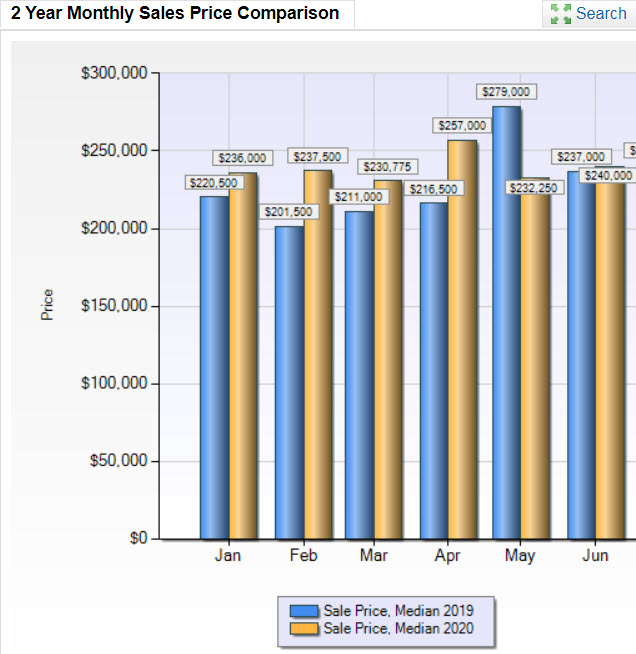
Median Price
Median Price is not the same as the Average Price; it is the middle point for real estate prices. The Median Price is the price in the middle of all the sales prices for a certain time-period, with exactly half of the houses priced for less and half priced for more.
It is generally believed that the Median Price is the best indicator for market activity because it is less affected by abnormally low prices or high prices (which skew the Average Price).
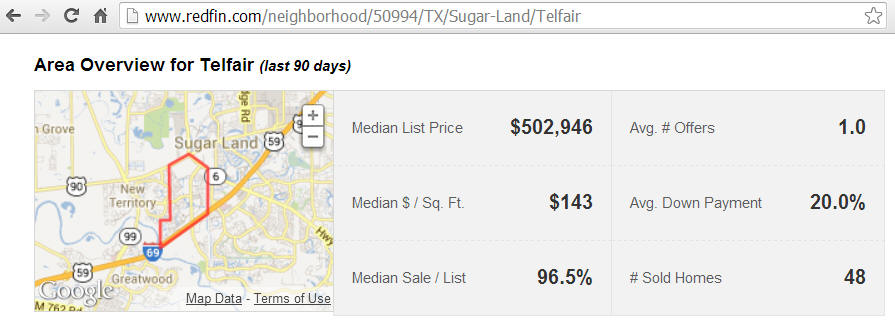
Overall Market Data for Past 6 Months
The following data is for Sold single-family properties in the past 6 months as of June 2020.
|
# Active |
# Sold |
Mths of Inventory |
Median CDOM* |
Median Sold Sales Price |
Highest Sold Price |
Lowest |
|
|
77479 (past 6 mths) |
376 |
494 |
4.6 |
71 |
$379K |
$2.25M |
$175K |
|
2019 |
n/a |
1078 |
n/a |
61 |
$364K |
$2.3M |
$165K |
|
2018 |
n/a |
1205 |
n/a |
65 |
$380K |
$2.7M |
$155K |
|
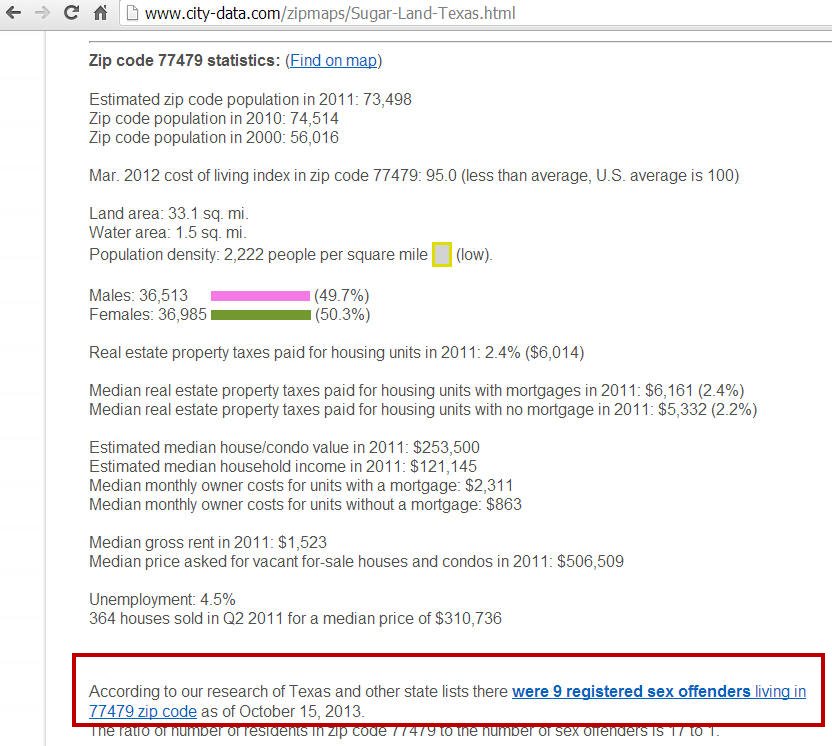
77478 (past 6 mths) |
87 |
100 |
5.2 |
83 |
$321K |
$4.9M |
$165K |
|
2019 |
n/a |
267 |
n/a |
50 |
$332K |
$1.87M |
$160K |
|
2018 |
n/a |
253 |
n/a |
33 |
$323K |
$4.7M |
$145K |
|
77459 (past 6 mths) |
332 |
800 |
2.5 |
76 |
$296K |
$2.6M |
$125K |
|
2019 |
n/a |
1453 |
n/a |
67 |
$295K |
$1.87M |
$118K |
|
2018 |
n/a |
1253 |
n/a |
60 |
$298K |
$2.1M |
$87K |
|
77498 (past 6 mths) |
95 |
195 |
2.9 |
61 |
$236K |
$800K |
$120K |
|
2019 |
n/a |
463 |
n/a |
32 |
$228K |
$1.4M |
$97K |
|
2018 |
n/a |
489 |
n/a |
24 |
$220K |
$778M |
$80K |
NOTE: The number of Actives on the market and Current Inventory is only applicable to now…we don’t know the number of Actives in the past.
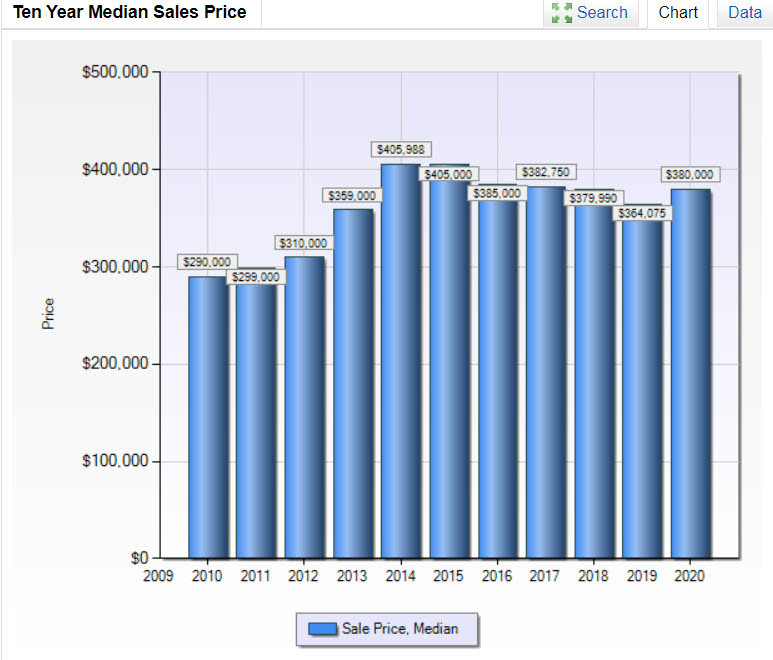
Trends for Sugar Land (77479)
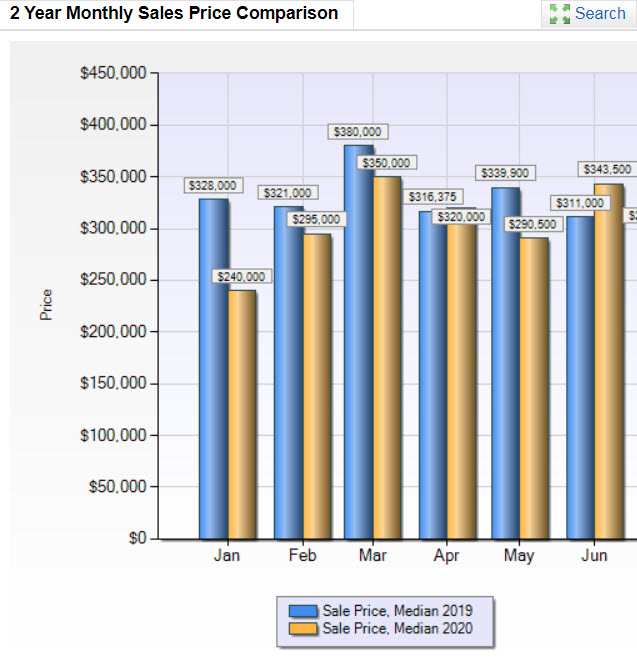
Trends for Sugar Land (77478)

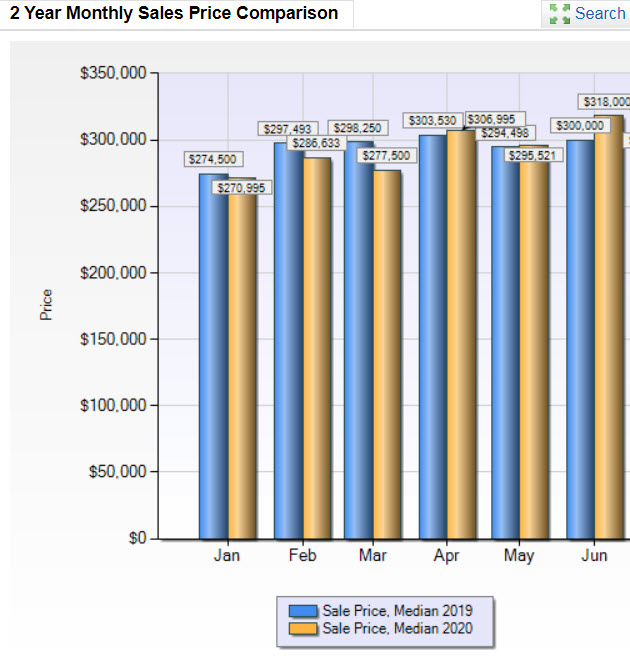
Trends for Sugar Land (77459)
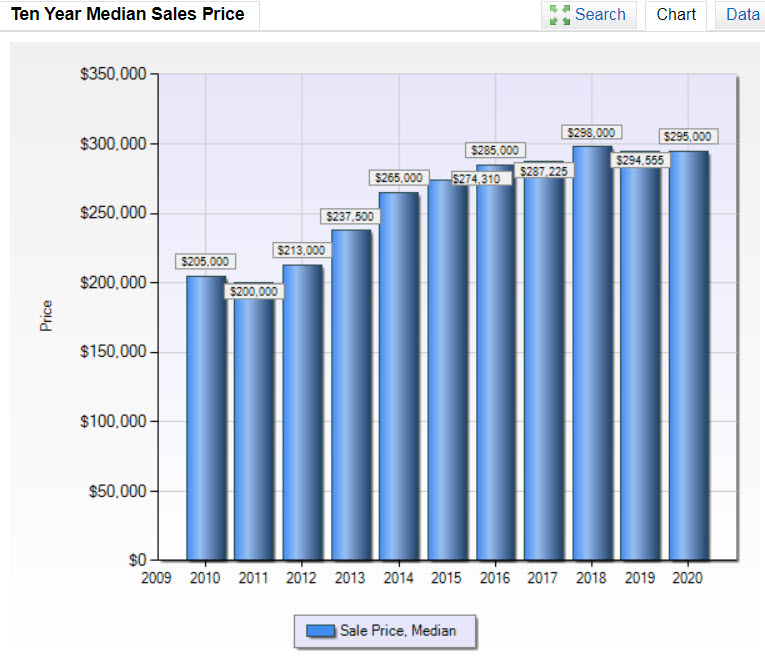
Trends for Sugar Land (77498)
⇒ See Pricing a Home Correctly
Get the Full Report!
So I put together my Sugar Land Housing Market Report for you, which covers:
- List of the fastest selling neighborhoods in the Sugar Land area
- Market data on the most popular neighborhoods
- Ten-year trend of average sales prices by ZIP Code
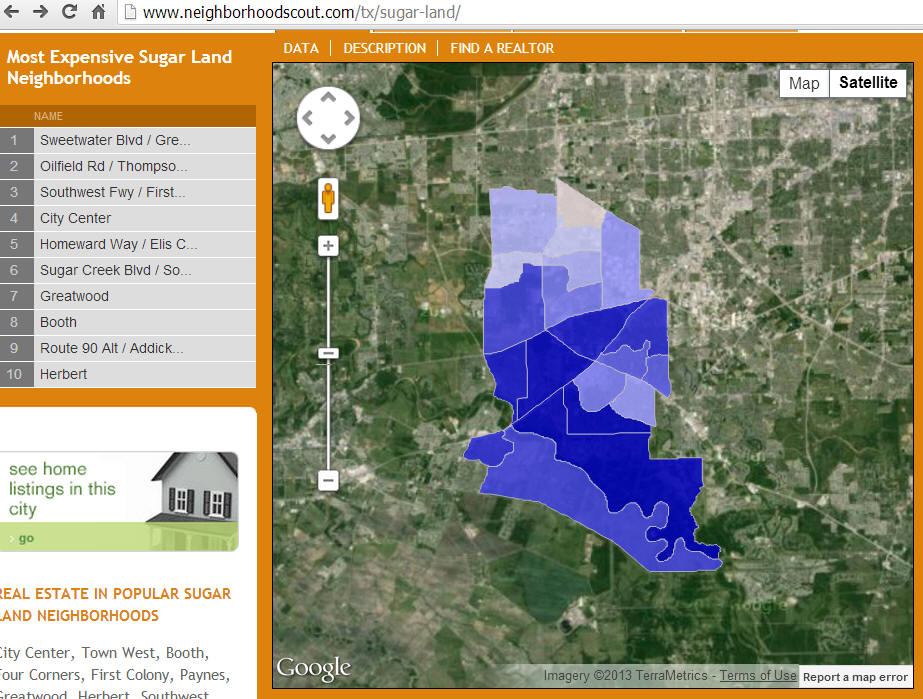
- List of the most expensive neighborhoods in the Sugar Land area
This is helpful information if you are thinking about buying soon.
 |
Get the Report! Updated as of June 2020
|